
Last Updated on February 19, 2026 by Statnzee Team
In today’s data-driven world, how you present data is often as important as the data itself. Among the most popular tools for visualization are:
- Pandas + Matplotlib (Python-based, code-driven)
- Tableau (drag-and-drop, business-focused)
Both are powerful—but built for different audiences.
In this article, we’ll compare them fairly and practically, with learning resources and official links to help you decide.
📊 Pandas + Matplotlib (Python-Based Visualization)
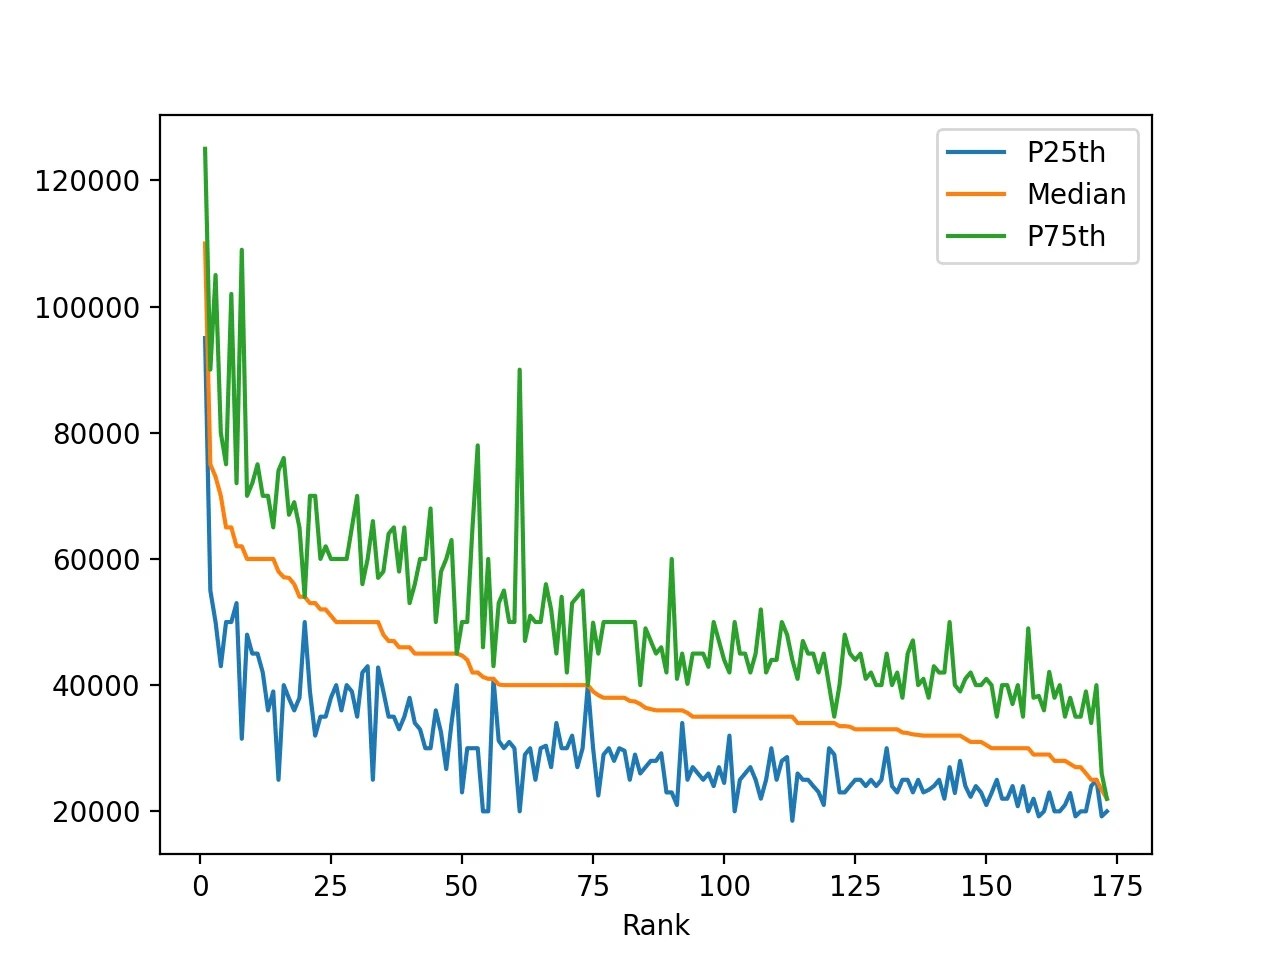
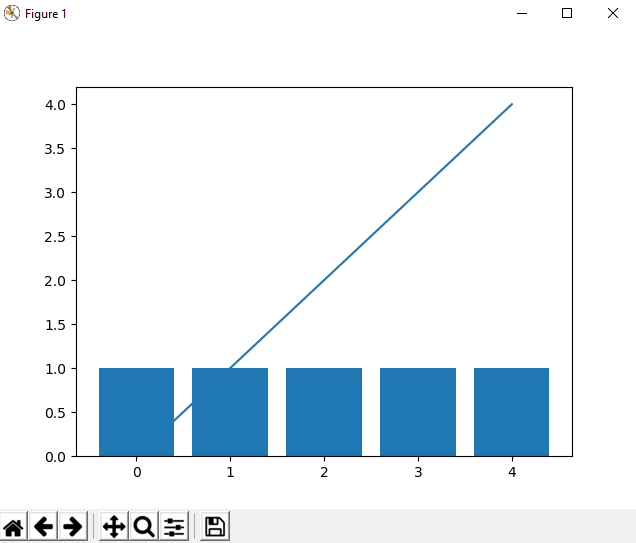


🔹 What Is Pandas + Matplotlib?
- Pandas → Data cleaning, filtering, analysis
- Matplotlib → Chart and plot creation
- Used mainly inside Python scripts and Jupyter Notebooks
They are core tools in data science, AI, and research workflows.
✅ Key Strengths
1. Complete Customization
With code, you control:
- Colors
- Fonts
- Layouts
- Labels
- Annotations
You can design publication-quality charts.
2. Ideal for Technical Work
Perfect for:
- Machine Learning
- AI projects
- Scientific research
- Automation pipelines
It integrates seamlessly with NumPy, Scikit-learn, and TensorFlow.
3. Free and Open Source
No licenses. No subscriptions. No vendor lock-in.
4. Excellent for Automation
You can:
- Auto-generate reports
- Schedule charts
- Embed visuals in apps
⚠️ Limitations
1. Requires Programming Skills
You must know:
- Python
- Plotting syntax
- Debugging
Not beginner-friendly for non-programmers.
2. Limited Interactivity
By default, plots are static.
Advanced interaction requires extra tools (Plotly, Dash, Bokeh).
3. Slower Dashboard Development
Building dashboards takes more time and frameworks.
📌 Best Use Cases
✔ Data Science
✔ AI & ML Projects
✔ Research Papers
✔ Automated Reporting
✔ Academic Work
🔗 Official Learning Links
- Pandas Documentation:
https://pandas.pydata.org/docs/ - Matplotlib Documentation:
https://matplotlib.org/stable/ - Jupyter Notebook:
https://jupyter.org/ - Python Official Site:
https://www.python.org/
📈 Tableau (Business Intelligence & Visual Analytics)



🔹 What Is Tableau?
Tableau is a professional visual analytics platform developed by Tableau Software.
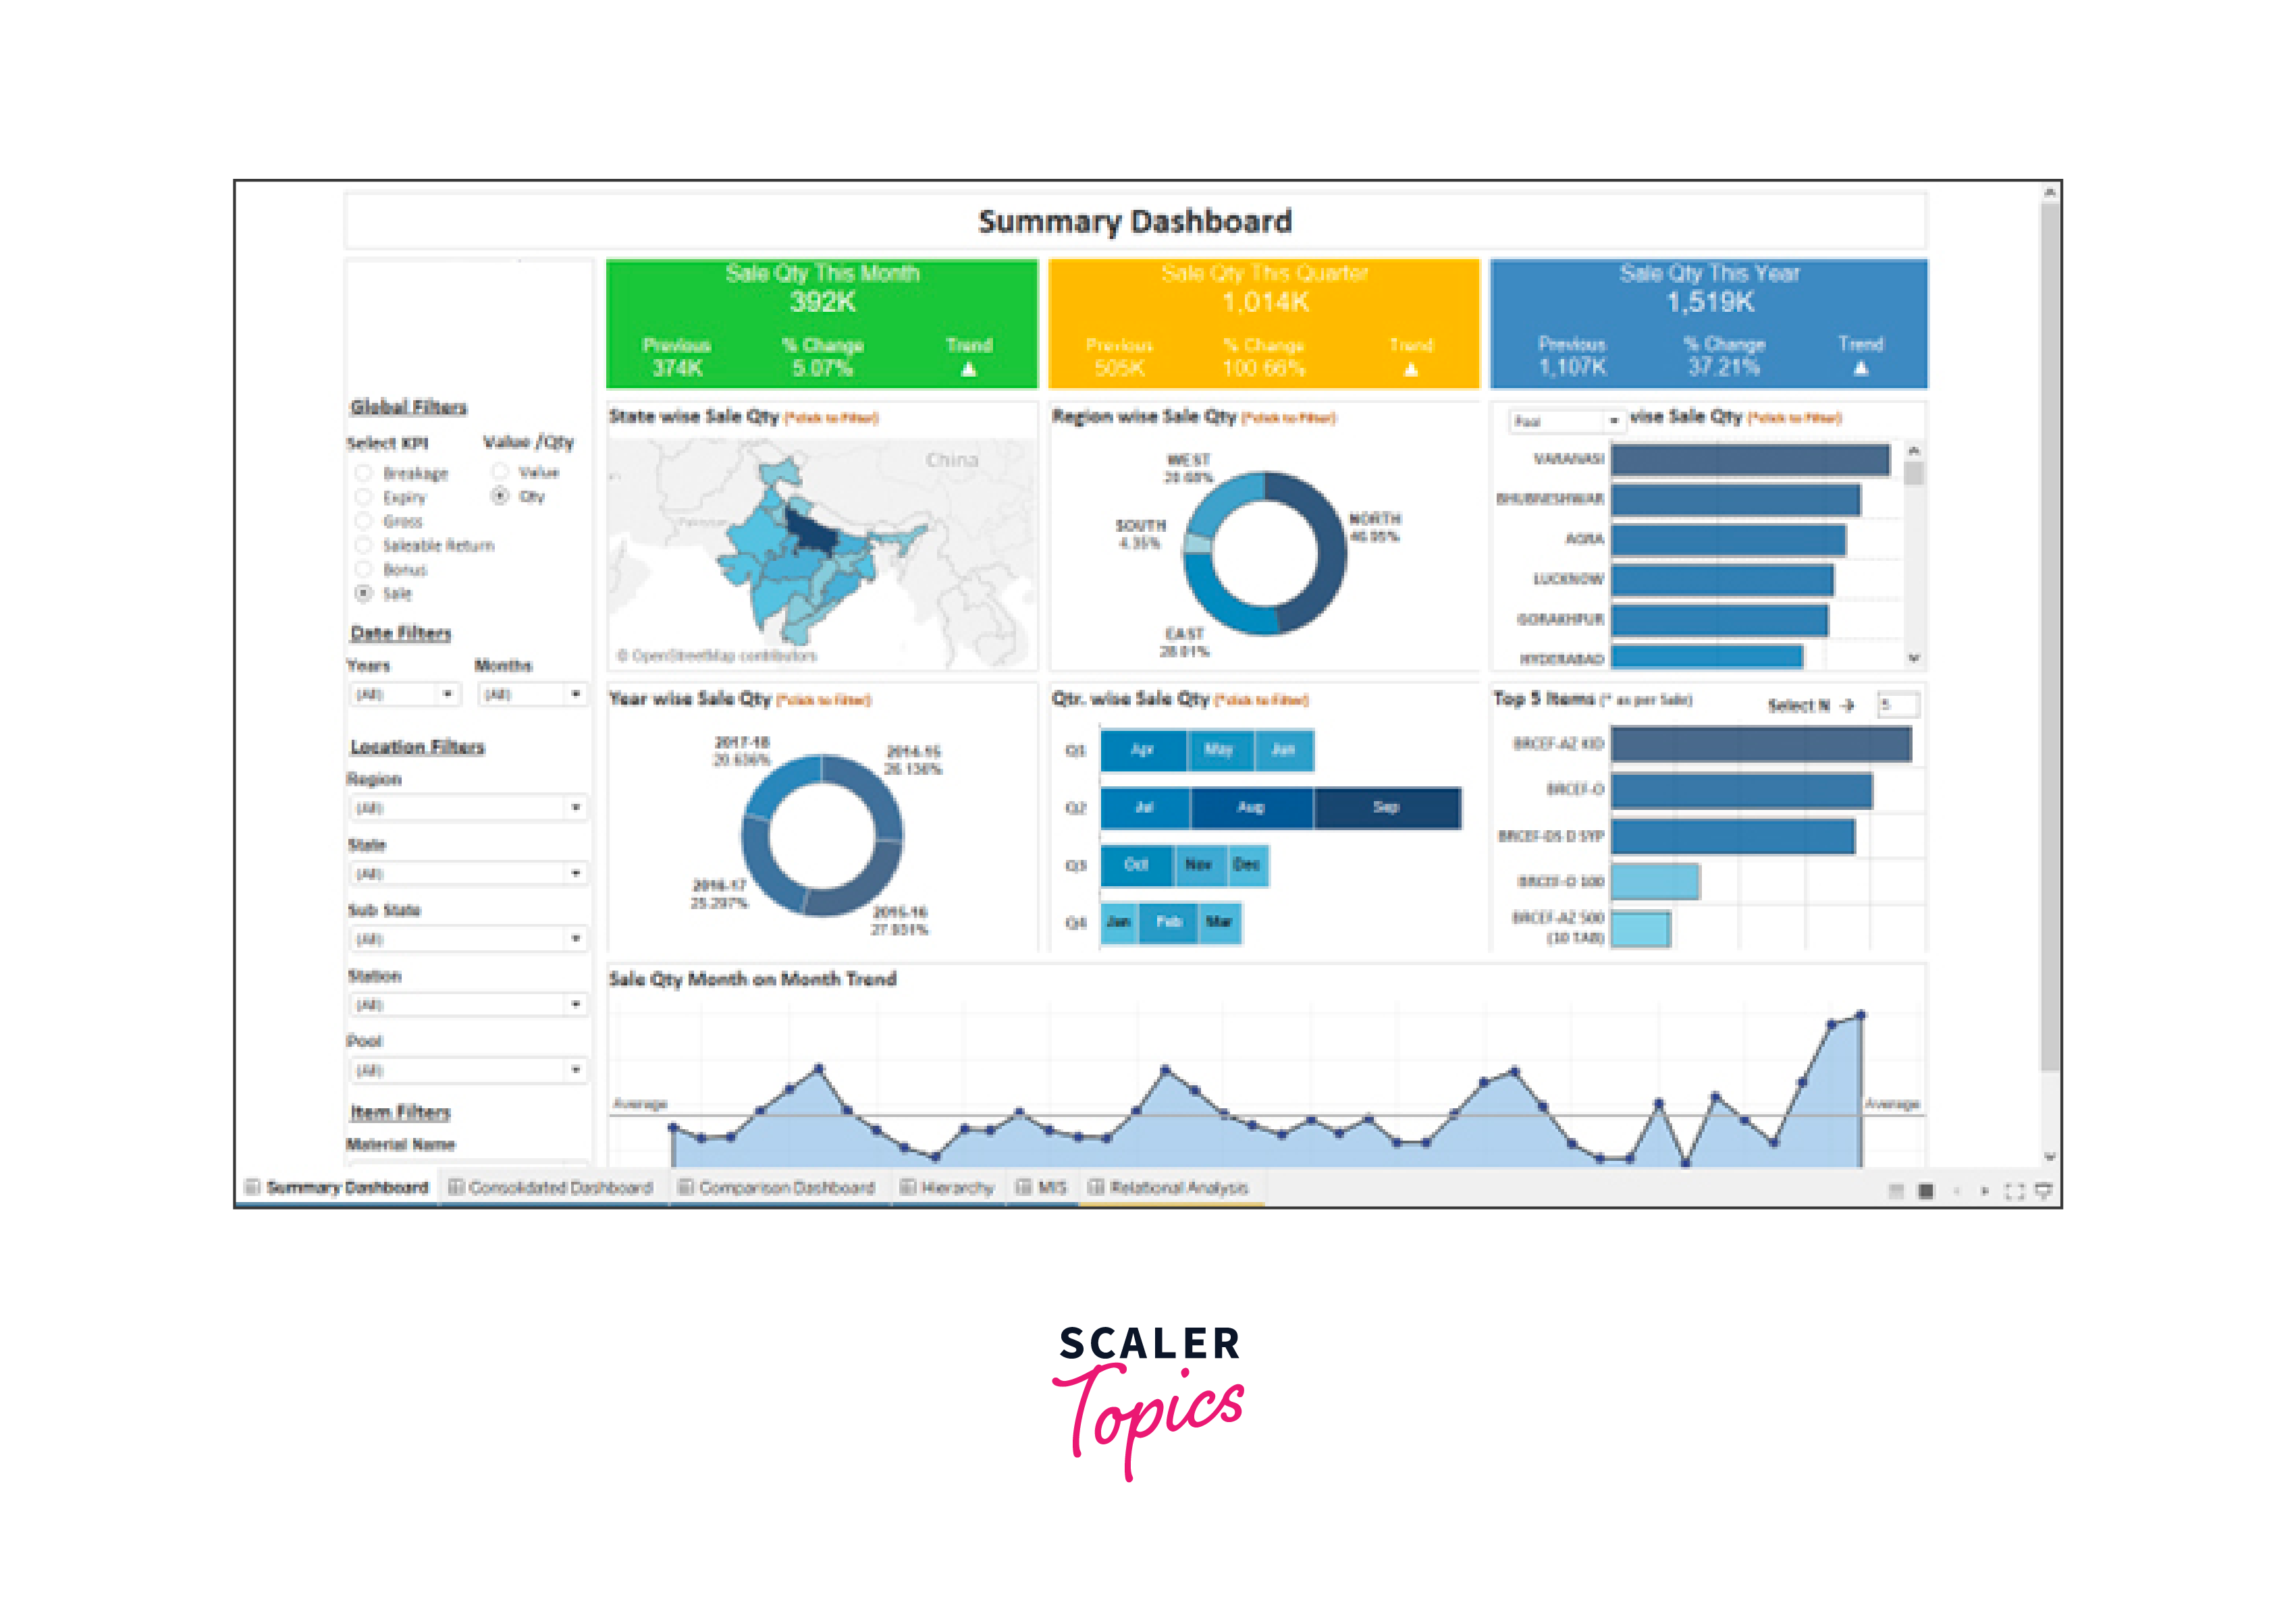
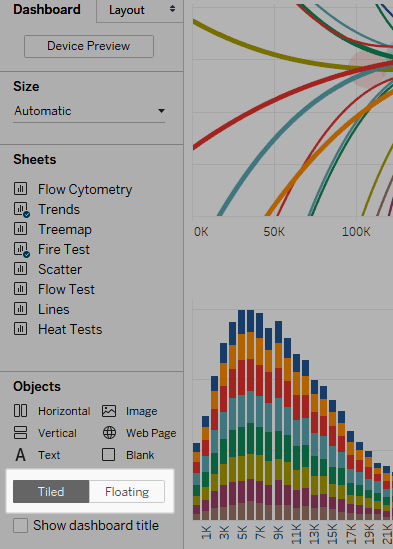
It focuses on drag-and-drop dashboards for business users—no coding needed.
✅ Key Strengths
1. Extremely Easy to Learn
You can build dashboards by:
- Dragging fields
- Dropping charts
- Clicking filters
No programming required.
2. Built-in Interactivity
Tableau dashboards support:
- Filters
- Drill-downs
- Hover tooltips
- Dynamic views
All available by default.
3. Enterprise-Ready
Supports:
- Cloud databases
- Big data systems
- Team collaboration
- Role-based access
4. Business-Friendly Design
Managers and executives can explore data without technical help.
⚠️ Limitations
1. Expensive
Tableau licenses can be costly for individuals and startups.
2. Limited Custom Design
You cannot customize visuals as deeply as with code.
3. Vendor Lock-In
Your work depends on Tableau’s ecosystem.
4. Weak for AI/ML Workflows
Not designed for:
- Model training
- Feature engineering
- Research pipelines
📌 Best Use Cases
✔ Business Dashboards
✔ Sales Analytics
✔ Marketing Reports
✔ Executive Presentations
✔ Corporate BI
🔗 Official Learning Links
- Tableau Official Site:
https://www.tableau.com/ - Tableau Learning Resources:
https://www.tableau.com/learn - Tableau Public (Free Practice):
https://public.tableau.com/ - Tableau Training Videos:
https://www.tableau.com/learn/training
⚖️ Side-by-Side Comparison
| Feature | Pandas + Matplotlib | Tableau |
|---|---|---|
| Learning Curve | Steep | Easy |
| Coding Needed | Yes | No |
| Cost | Free | Paid |
| Customization | Very High | Medium |
| Interactivity | Low (Default) | High |
| Automation | Excellent | Limited |
| Collaboration | Manual | Built-in |
| ML Integration | Strong | Weak |
🎯 Which One Should You Choose?
✅ Choose Pandas + Matplotlib If You:
✔ Want a career in AI/Data Science
✔ Like programming
✔ Need automation
✔ Work with large pipelines
✔ Prefer open-source tools
Best for: Developers, researchers, ML engineers
✅ Choose Tableau If You:
✔ Work in business or consulting
✔ Need fast dashboards
✔ Don’t want to code
✔ Present to management
✔ Work in teams
Best for: Business analysts, managers, consultants
🧠 Real-World Practice: Most Professionals Use Both
In many companies, the workflow looks like this:
1️⃣ Analyze data in Python (Pandas)
2️⃣ Build models and insights
3️⃣ Export results
4️⃣ Visualize in Tableau
This combines:
- Technical depth (Python)
- Business clarity (Tableau)
📌 Final Verdict
🥇 Pandas + Matplotlib
Best for analysis, research, and automation
Powerful and flexible—but requires skill.
🥇 Tableau
Best for business reporting and storytelling
Fast and intuitive—but costly and less customizable.
✅ One-Line Summary
Use Pandas + Matplotlib to analyze and build.
Use Tableau to present and communicate.
🚀 Recommended Learning Path
If you’re starting today:
Step 1: Learn Python Visualization
- Start with Pandas + Matplotlib
- Practice in Jupyter Notebook
Step 2: Learn Business Dashboards
- Try Tableau Public
- Build sample dashboards
Step 3: Combine Both
- Analyze in Python
- Present in Tableau
This makes you highly employable in both technical and business roles.
Discover more from Statnzee
Subscribe to get the latest posts sent to your email.
Leave a Reply