• Skip to main content
  • Skip to secondary menu
  • Skip to primary sidebar
  • Skip to footer
  • Home
  • Blog
  • About
  • Terms
    • Privacy
    • Disclaimer
  • Services
  • Contact
  • Subscribe
statnzee.com logo

Statnzee

Trust Statnzee to strengthen your online presence, streamline operations, and drive sustainable growth.

Search

  • Blog
  • Web Development
  • Financial Solutions
  • Data Science
  • Learning
  • Trending

📊 Understanding Pearson Correlation: From Intuition to Financial & Business Applications

February 5, 2026 by Statnzee Team Leave a Comment

Last Updated on February 5, 2026 by Statnzee Team


Correlation is one of the most widely used concepts in statistics, finance, and business analytics. It helps us answer a simple but powerful question:

Do two variables move together—and if yes, how strongly?

This article explains Pearson correlation:


🔹 What Is Pearson Correlation?

The Pearson Correlation Coefficient measures the strength and direction of a linear relationship between two variables.

Its value lies between:

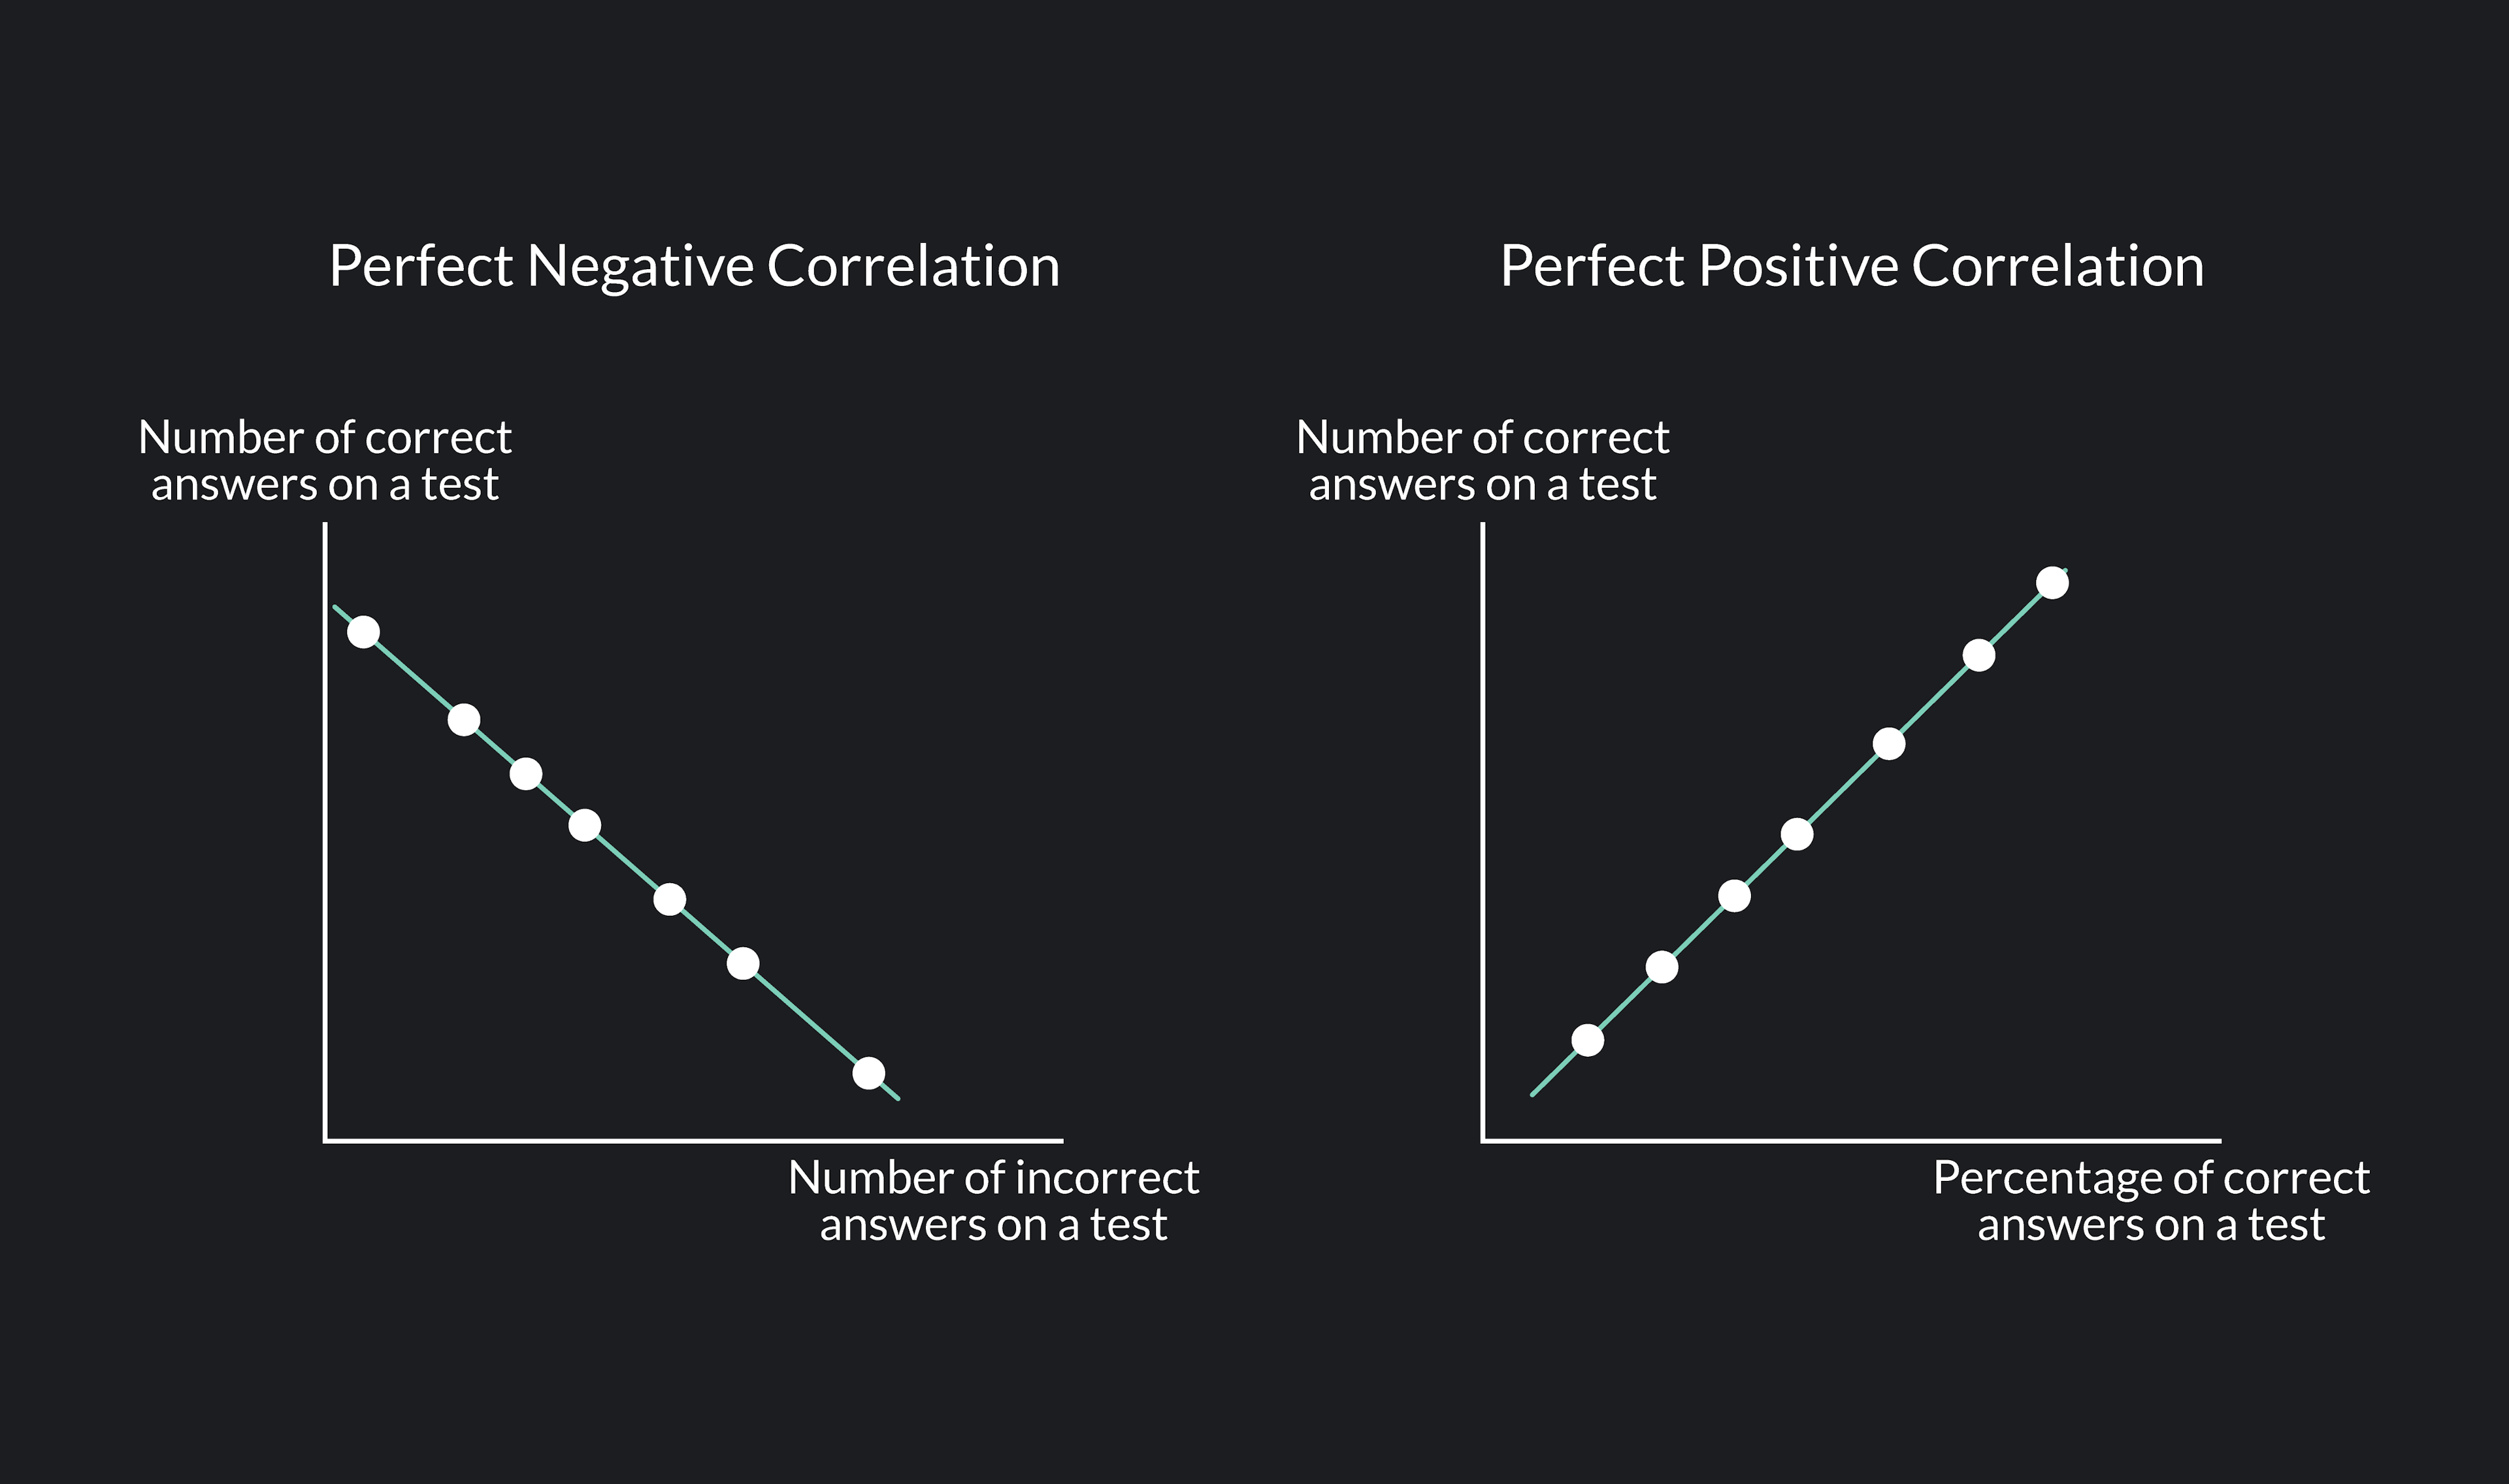
  • +1 → Perfect positive correlation
  • 0 → No linear correlation
  • –1 → Perfect negative correlation

Example:

  • Marketing spend ↑ → Sales ↑ (positive)
  • Interest rates ↑ → Loan demand ↓ (negative)

🔹 Intuition Behind Pearson Correlation (Plain English)

Instead of comparing raw values, Pearson correlation compares how much each value differs from its average.

These differences are called deviations:

  • X deviation:
    x_i-\bar{x}
  • Y deviation:
    y_i-\bar{y}

If both deviations are positive or both are negative, the variables are moving together.


🔹 Step 1: Compute the Mean

For X:

\bar{x}=\frac{1}{n}\sum_{i=1}^{n}x_i

For Y:

\bar{y}=\frac{1}{n}\sum_{i=1}^{n}y_i

🔹 Step 2: Measure Joint Movement (Covariance)

Multiply deviations:

(x_i-\bar{x})(y_i-\bar{y})

Average them:

\text{Cov}(X,Y)=\frac{1}{n}\sum_{i=1}^{n}(x_i-\bar{x})(y_i-\bar{y})

Covariance tells us direction, but its value depends on units.


🔹 Step 3: Measure Individual Movement (Standard Deviation)

For X:

\sigma_X=\sqrt{\frac{1}{n}\sum_{i=1}^{n}(x_i-\bar{x})^2}

For Y:

\sigma_Y=\sqrt{\frac{1}{n}\sum_{i=1}^{n}(y_i-\bar{y})^2}

🔹 Step 4: Normalize → Correlation

Divide covariance by total variability:

r=\frac{\text{Cov}(X,Y)}{\sigma_X\sigma_Y}

🔹 Final Pearson Correlation Formula


📈 Visualizing Correlation with Graphs

1️⃣ Strong Positive Correlation (Marketing vs Sales)

  • Points slope upward
  • More ad spend → More revenue
  • Typical value:
    r\approx+0.8

2️⃣ Strong Negative Correlation (Interest Rate vs Loan Demand)

Image
Image
  • Points slope downward
  • Higher interest → Lower borrowing
  • Typical value:
    r\approx-0.7

3️⃣ No Correlation (Random Business Variables)

Image
Image
  • No visible pattern
  • Variables unrelated
r\approx0

4️⃣ Financial Example: Stock Returns Correlation

  • Used in portfolio diversification
  • Helps manage risk

💼 Business & Financial Use Cases


🏦 1. Portfolio Diversification (Finance)

Investors analyze correlation between stocks.

CorrelationMeaning
r=0.9High risk
r=0.2Good diversification
r<0Hedging

Used by:

  • Mutual funds
  • Hedge funds
  • Asset managers

💳 2. Banking: Interest Rates vs Loan Demand

Banks track:

  • Interest rates
  • Loan applications

Typically:

r<0

Helps with:

  • Loan pricing
  • Revenue planning
  • Risk control

📢 3. Marketing ROI Analysis

Businesses correlate:

  • Advertising spend
  • Sales revenue

If:

r>0.7 → Campaign effective
r<0.3 → Budget inefficiency

Used in:

  • Google Ads
  • Affiliate marketing
  • Performance marketing

🧾 4. Credit Risk & FinTech

Banks and fintech platforms correlate:

  • Credit score
  • Default probability

Strong negative correlation = reliable credit model.


⚠️ Correlation ≠ Causation

Correlation does not imply cause.

Example:

  • Ice cream sales ↑
  • Drowning incidents ↑

Both increase in summer—but one does not cause the other.


📐 Geometric Interpretation (Advanced Insight)

Mathematically:

r=\cos(\theta)

Correlation is the cosine of the angle between deviation vectors.

AngleMeaning
0°Perfect positive
90°No correlation
180°Perfect negative

📚 Learning Resources

  • Pearson Correlation (Wikipedia)
    https://en.wikipedia.org/wiki/Pearson_correlation_coefficient
  • Khan Academy – Statistics
    https://www.khanacademy.org/math/statistics-probability
  • StatQuest (YouTube – Best Visual Explanations)
    https://www.youtube.com/@statquest
  • Jetpack LaTeX Guide
    https://jetpack.com/support/beautiful-math-with-latex/

✅ Final Takeaway

Pearson correlation measures how strongly two variables move together after removing scale effects.

It is foundational for:

  • Finance
  • Banking
  • Marketing
  • Data science
  • Risk management

Share this:

  • Share on Facebook (Opens in new window) Facebook
  • Share on X (Opens in new window) X

Like this:

Like Loading…

Related


Discover more from Statnzee

Subscribe to get the latest posts sent to your email.

Filed Under: Blog, Data Science, Financial Solutiohs Tagged With: Marketing, Sales, Use Cases

Reader Interactions

Leave a ReplyCancel reply

Primary Sidebar

More to See

One Large Website vs Multiple Smaller Websites: Which Business Model Is Better for Selling Digital Assets?

May 15, 2026 By Statnzee Team

HubSpot WordPress plugin

Hubspot: All-in-one platform to take care of marketing, sales, and customer service while taking a look at free HubSpot plugin for WordPress

January 30, 2023 By Statnzee Team

person using silver macbook pro

From WordPress Customization to Full-Stack Development: The Path to Mastering Web Development

December 2, 2022 By Statnzee Team

Understanding the Sandwich Theorem (Squeeze Theorem) and Its Real-World Applications

June 21, 2026 By Statnzee Team

Why Can We Add Solutions Together? Understanding the Principle of Superposition

June 20, 2026 By Statnzee Team

Recent

  • How a Tiny Unfair Advantage Can Lead to Massive Success: Lessons from the Gambler’s Ruin Problem
  • Understanding the Sandwich Theorem (Squeeze Theorem) and Its Real-World Applications
  • Why Can We Add Solutions Together? Understanding the Principle of Superposition
  • Gambler’s Ruin, Recurrence Relations, and Why the General Solution Has Two Constants
  • Could This Average Speed Get You Fined? The Calculus Says Yes

Footer

Archives

Terms Display
Website Optimization Tailwind Ghostwriter Software Trends Online MBA WordPress Plugin Probability Share Trading Starter Website Package Resume Use Cases Pandas Sales SaaS Software Development SEO Web Development Resume Writing SQL Online Learning WP Engine Agency Partner PHP Share Market Spocket Programming TurtlemintPro Insurance Advisor Referral Programs Optimization Share Investment Writing Tools Wolfram Mathematica Python Starter Websites Option Trading Small Business RDBMS WordPress Small Business Solutions Search Engine Ranking Web Hosting Saylor Academy MBA Program Programming Languages Tags: Hyperbolic Cosine Startups Tags Tableau
  • Home
  • Blog
  • About
  • Terms
    • Privacy
    • Disclaimer
  • Services
  • Contact
  • Subscribe

Disclaimer: This website may use AI tools to assist in content creation. All articles are reviewed, edited, and fact-checked by our team before publishing. We may be compensated for placement of sponsored products and services or your clicking on links posted on this website. This compensation may impact how, where, and in what order products appear. We do not include all companies or all available products.

Loading Comments...

    %d